Fronts, Depressions and Anticyclones
Created | Updated Jun 9, 2008
You will probably hear these atmospheric features mentioned a lot. They are very common and very important because they drastically affect the weather you will experience. Let's start with some definitions. A front is, in the meteorological sense, a region where two air masses meet. These air masses have different characteristics (such as temperature and humidity) and this interaction produces some interesting weather. Depressions and anticyclones are essentially polar opposites. A depression - also called a cyclone or just a low - is a centre of relatively low air pressure in the atmosphere. An anticyclone - a high - is a region of relatively high air pressure. Remember that most of the features in this Entry are highly generalised. There are many exceptions, so we can only put together a set of 'guidelines'.
Anticyclones
People tend to like anticyclones. If there's a high pressure system around there is likely to be very little cloud in the sky. This is because air is converging high up in the atmosphere and then descends to the surface. It is this descending air which produces the high pressure - more air is coming into the region from above than is leaving from the side.
Anticyclones tend to be 'made' from a dry air mass, since it sources a lot of it from higher up in the atmosphere where there is less water vapour. This means the huge blob of dense air tends to just sit there and not do a great deal, which is why, when anticyclones become established, they are hard to shift. This is the origin of the term 'blocking anticyclone', as these systems can prevent other systems such as depressions passing.
Anticyclones tend to produce fairly uniform weather. Winds will be light because wind is simply the movement of air down pressure gradients, and the pressure gradient near the centre of the anticyclone is quite slack (there is a mathematical proof for this which is beyond the scope of the Entry). What wind there is will spiral around and outwards from the high pressure centre in a clockwise direction in the Northern Hemisphere and an anticlockwise direction in the Southern Hemisphere (this is due to the Coriolis Effect of the Earth's rotation). The sinking air in the centre of the anticyclone is compressed as it sinks, so it warms up. It is therefore able to hold plenty of water vapour without clouds forming - lovely clear skies abound.
Every now and then weather forecasters will get caught out by high-pressure conditions. Usually they will produce clear skies, but occasionally it's a little different. The sinking air warms up, but there is a possibility that a temperature inversion could occur, where there is warmer air above cooler air (usually it is the other way round in the atmosphere). The inversion happens because the clear skies mean the Earth's surface loses a lot of heat - there is no insulating layer of cloud. A cool surface means cool air temperatures near the surface. This cool air is dense and hard to shift, so the warmer descending air sits on top. This usually happens at about a kilometre up. Under inversion conditions, whenever air rises it will be stopped by the warmer air above (since the rising air is cooler and denser than the stuff on top). If this air is moist, the water vapour can condense into a dreary layer of cloud which hangs around for days, since the winds are too light to disperse it.
There is a belt of high pressure where air converges at around 30 degrees latitude either side of the equator. These subtropical highs produce clear, dry and warm conditions, which is why many of the world's deserts are located at this latitude.
On a weather chart, pressure features are shown using isobars. These are lines joining up areas of constant pressure1. Imagine contour lines on a standard land map. They show how high the land is, how steep it is, and what shape the relief is. The same goes for isobars. When they are close together, this indicates a steep pressure gradient - pressure changes a lot in a small space. Anticyclones are essentially 'hills' on an isobaric map, representing peaks of pressure. But since the pressure gradient slackens towards the centre, these hills become less steep towards the peak.
Fronts
The two air masses that meet on a front usually have different densities. These density differences are usually caused by different temperatures, and sometimes humidity. It's important to remember that fronts are three-dimensional. The line you see on a weather map marks the location of where the two air masses meet at the surface - so this is called the surface front. To compound the confusion, when we talk about the upward extension of a front we called it the frontal surface. So the surface front is in the surface, the frontal surface isn't. Easy.
Fronts can also form higher up in the atmosphere, reaching up to the troposphere at 10 km. These fronts have a much less direct effect on the weather we experience and comparatively little is known about them. This Entry will focus on surface fronts.
Stationary Fronts
These are, interestingly, stationary. On a weather chart, they are drawn as an alternating red and blue line, with red semicircles facing the colder air and blue triangles facing the warmer air. These fronts don't tend to do an awful lot - they are just there to denote the boundary between two air masses.
One example of a stationary front is the polar front between warmer tropical air to the south and cold air from the poles. Perhaps this front is not very interesting on its own, but as we will see later, it can do some important things when it comes to producing depressions.
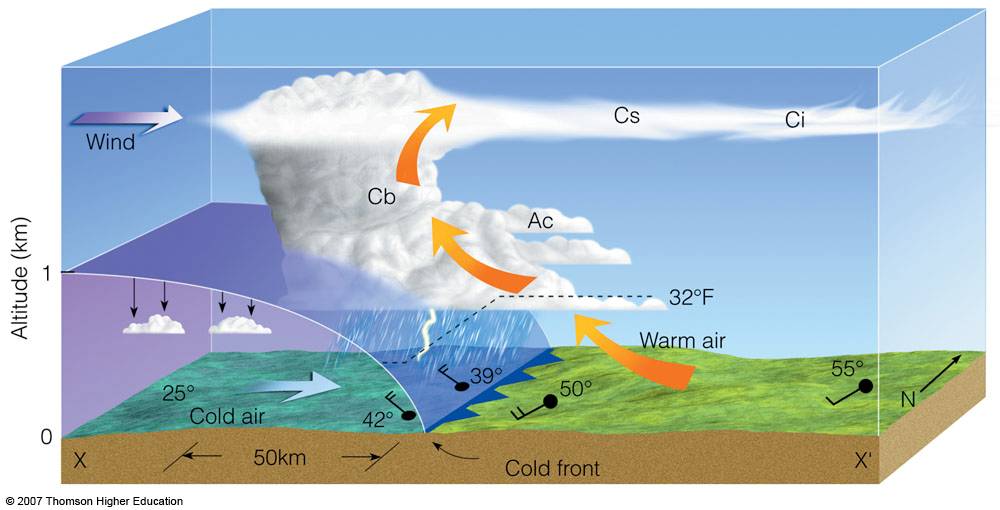
Cold Fronts
Here, cold, dry polar air is moving towards and undercutting less dense, warm moist air. It is drawn as a solid blue line with triangles pointing into the warm air, showing the direction of movement. The frontal surface is relatively steep, with a slope of something like 1 km vertical rise for every 50 km horizontally. This steepness means the warm air is shoved upwards rather suddenly, which is why cold fronts tend to produce quite heavy rain, often in sudden showers. Big, towering cumulus and cumulonimubus clouds form with very strong updrafts driving rapidly condensing air upwards. Winds tends to be quite strong and gusty along cold fronts.
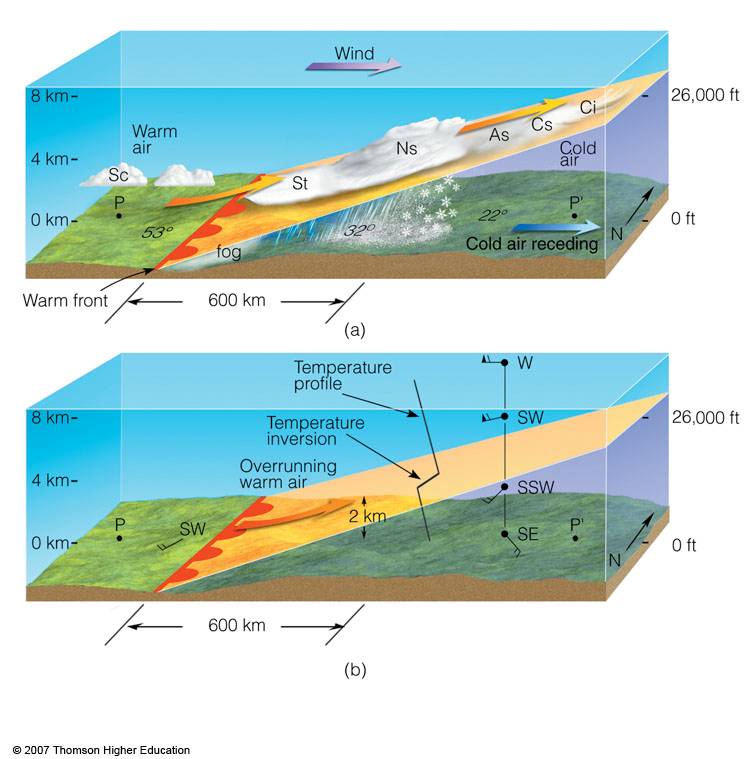
Warm Fronts
On a weather map these are drawn as red lines with semicircles pointing into the cold air. They represent areas where warm, moist, subtropical air moves towards and rises above the denser cold air it is meeting. They tend to be slower moving than cold fronts, moving at 10 knots, or around half the speed of the other. They slope much more gently as well, at around 1 km vertical rise for every 300 km horizontally.
The warmer air rises up and over the colder, denser air in a process called overrunning. This means clouds and rain can form well ahead of the surface front's boundary. We may see some cloud over 1200 km away from the surface front. At this point it will be very high cloud composed of ice crystals (called cirrus). As the front moves forwards, the cirrus will gradually thicken into a layer of cirrostratus, whose ice crystals often cast a halo around the sun2. Then the clouds will thicken and lower into altocumulus and altostratus, and the sky will be overcast and grey. Within a few hundred kilometres of the warm front at the surface it may begin to rain (or snow if it is cold enough). Throughout this trip the air pressure will be slowly falling.
After a warm front passes over we are in a warm sector, where the air is moister, and warmer. In the warm sector the air pressure stops falling.
Occluded Front
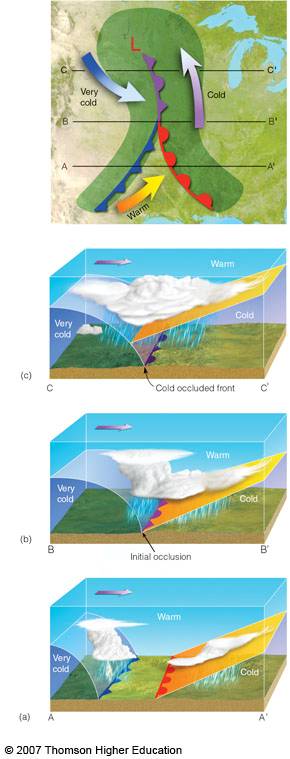
These appear when a cold front catches up with a warm front. They are drawn on the chart as purple lines with alternating triangles (representing the cold front), and semicircles (represting the warm front). There are two types: warm and cold. Warm and cold occluded fronts, that is - these are completely different to the warm and cold fronts mentioned above.
The cold occlusion occurs when the air behind the occluded front is colder than the air in front of it. Imagine a cold front approaching the slower-moving warm front. When it collides with the warm air it forces itself underneath and lifts the warm sector completely off the ground. So the warm front is no longer at the surface. The cold front technically still reaches the surface, but now we call it a cold occlusion or a cold-type occluded front. As this type of occlusion approaches, it will seem very similar to a warm front, with high clouds gradually lowering and thickening. But a surprise lurks, because when the actual occluded front passes it will feel very much like a cold front, with heavy, showery precipitation. Immediately after the cold occlusion passes the air temperature will drop noticeably.
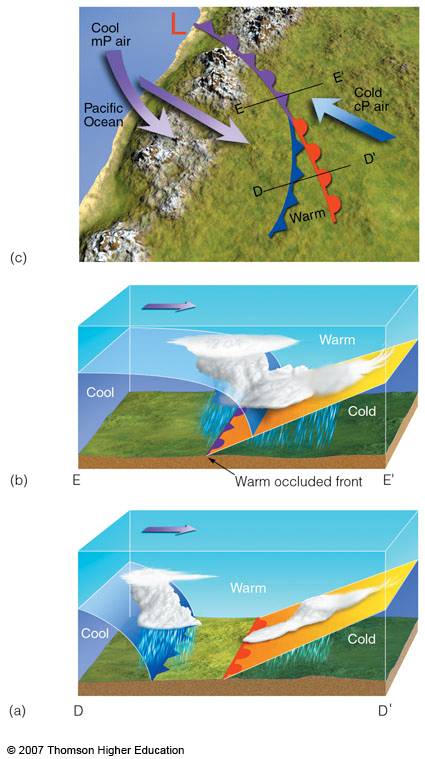
In the case of a warm occlusion, the air ahead of the warm front is colder than the air behind the cold front. In other words, the air is denser ahead of the warm front. This means that when the cold front catches up, the milder, less dense air behind the cold front can't lift the colder air off the ground. So the cold front ends up sliding up over the warm front. Now we have a warm front extending down to the surface, but the cold front up on top of it means it is now a warm-type occluded front. The weather associated with this type is very similar to that of a warm front.
Occluded fronts have, slightly over-excitedly, been called the mavericks of the world of weather fronts. They usually form when a cold front overtakes a warm front, but they are not always that predictable. Some appear to form as new fronts in their own right, in a fashion not completely understood.
Depressions
Also known as cyclones because these systems rotate in anticlockwise in the Northern Hemisphere (and clockwise in the Southern Hemisphere), the opposite direction to anticyclones. There are two types of depression: mid-latitude and tropical. For some reason, the world leaders in the study of mid-latitude cyclones came from Norway. A number of Norwegian meteorologists, including Vilhelm Bjerknes, his son Jakob, Halvor Solberg, and Tor Bergeron3, produced a model of how these systems worked. The Norwegian cyclone model was published in a paper not long after World War I, and has been refined since then. It is usually referred to now as the 'polar front theory of a developing wave cyclone', or the 'polar front theory'.
On a weather map, these systems are usually shown using isobars. Like the anticyclone, they will be circular, but this time the pressure values will get lower towards the centre and quite often the gradient will get steeper.
Polar Front Theory
Let's go back to the polar front mentioned earlier. This is where our mid-latitude depression is born. The polar front isn't really quite how we assume it to be here. We assume it is a more or less continuous boundary with polar air on one side and tropical air on the other. In reality the boundary is nowhere near as precise. But this is one of the key principles of meteorology, and in fact science is general: it it's complicated, simplify it until you can do things with it.
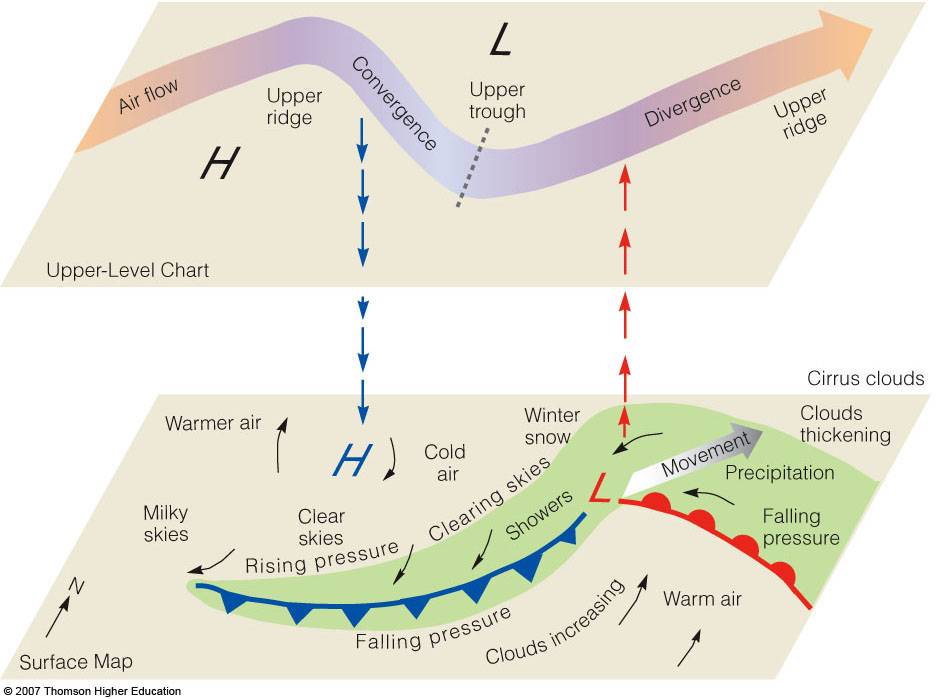
So imagine you have the polar front, oriented straight East-West for simplicity. We are going to assume it is in the Atlantic, which is a fertile breeding-ground for depressions. To its north cold air blows south, curving westwards parallel to the front. To the south, warm air blows north and curves eastwards parallel to the front. The reasons for this situation changing are rather complex, and not fully understood even now. Basically, a wavelike kink forms in the polar front. The main reason for this is what the air is doing at upper levels (around 5 km up, usually). In our model there is always a mid-latitude jet stream above the polar front (this does happen but is not always exactly true) - a 'river' of fast-flowing air which flows west-to-east around the globe in a wave-like pattern4. When this jet stream curves, it becomes compressed in the middle, so on the eastern side of the curve the stream suddenly becomes wider. In other words, air spreads out, or diverges. This divergence sucks up air from the surface to replace the air flowing away, creating a low-pressure centre.
Now we're away. Once a centre of low pressure is formed winds start flowing around it in a roughly circular pattern5. Remember winds flow anticlockwise around low pressure. So now our frontal wave, also known as an incipient cyclone, is up and running.
Now, the fronts rotate around this low pressure, following the wind. To the eastern side, the wind is blowing northwards. This produces a warm front on this side. To the west, the wind flows southwards, producing a cold front as the cold air pushes south.
The jet stream essentially steers the system from here. As it curves, imagine it wriggling eastwards across the globe like a snake. This means the divergence at upper levels moves gradually westwards. The divergence does what it always does and produces low pressure beneath it. So to the west of the low the pressure is slowly rising and to the east the pressure is slowly falling, moving the low pressure centre and its attached fronts eastwards.
Over perhaps the next day or so the frontal wave will develop into an open wave. Here, the warm front curves south-east from the centre and the cold front curves south west. In between them, on the southern side, there is a wedge of warm, moist tropical air - the warm sector. The humidity means scattered fluffy clouds often form here.
As the open wave continues moving eastward the air continues rising, its energy provided by the less dense air of the warm sector, causing the central pressure to decrease so the winds around it blow more strongly. The cold front moves more quickly because it is denser and so has more momentum. This means it pushes through the warm sector more easily than the warm front pushes through the cold air. As the cold front catches up the warm sector is squeezed into a smaller area. At this point the storm is usually at its most intense and the rain from it covers the largest area. Eventually the cold front catches up with the warm front and an occlusion forms (this first occurs closest to the low pressure centre, where the two fronts are always closest together). The point at which the cold, warm and occluded fronts meet is called the triple point or the point of occlusion. At this point the cold and warm fronts look very similar to an open wave cyclone, and sometimes a new wave, or secondary low can form here. Occasionally a whole string on low pressure centres can be seen moving across the Atlantic.
Now there is cold air all around the low pressure centre at the surface, so it no longer has the rising warm air to keep the pressure low. Therefore the centre gradually 'fills' and dissipates. The ripple in the polar front gradually dies away as the fronts become less distinct and air masses mix and the warm sector disappears. This is a bit like an eddy in a stream of water. If there is an obstacle in the stream the ripple forms and produces a whirling eddy, which moves with the flow before gradually vanishing downstream. The cyclone life cycle can last from a few days to over a week.
Tropical vs. Mid-latitude
A tropical depression has similar characteristics to a mid-latitude one, but the greater heat energy in the tropics means such systems can develop into tropical storms or even hurricanes. Hurricanes, though they are technically depressions because of the very low pressure at their centre, are quite different from mid-latitude cyclones.
A hurricane gets its energy from warm tropical waters and the moisture in the air6. A strong mid-latitude cyclone becomes a mid-latitude storm, and it derives energy from strong contrasts in air temperature over short distances. In the upper levels of the atmosphere a hurricane has a warm core (its 'eye') while a cyclone has a cold core. Air sinks in the eye of a hurricane and rises in the centre of a cyclone.
Other Things You Might See On An Analysis Chart
The three types of feature covered in this Entry are the most common things you will see on a meteorological analysis chart. They produce a useful summary of what the conditions are like in the atmosphere. In addition, you might see thick black lines, which are sometimes call squall lines. These are not fronts per se, but are areas of disturbance which tend to produce lines of rain showers.
The eagle-eyed may spot dashed lines (usually in red if the chart is in colour) which are numbered with the atmosphere's thickness. These work in the same way as isobars, joining up areas with the same thickness. But what is thickness. It is basically a useful measure of how warm the air is. To be precise, it is the height (usually given in decametres, dm, - tens of metres) between two pressure levels. Usually these pressure levels are 1000mb (approximately the average pressure at the surface) and 500mb. Since the way pressure decreases with height is related to air temperature, the greater the thickness, the warmer the air is. This is why you will usually see thickness is relatively small over polar regions, where the air is cold. The 528dm (so the 500mb level is 5,280 metres or 5.28 km above the 1000mb level) is often seen as a general indicator of snow. Though not clear-cut, the air usually needs to be around this temperature for snow to fall. So in the United Kingdom, for example, icy blasts from the Arctic can cause the 528 line to bulge southwards. Anywhere poleward (in this case, north) of the 528 line might well experience some snow as long as there is enough moisture in the atmosphere.
Furthermore
This Entry is only an introduction. Atmospheric features come about as a result of extremely complex interlinking process, which, most terrifyingly, all have equations to represent them. It is these equations that meteorologists mash together in a computer in a process more properly known as 'modelling'. Computer models allow meteorologists to build up a detailed picture of how and why the atmosphere works the way it does. Once these processes are understood, we can then use these models to forecast the weather.